Product Ideas
Share your suggestions and ideas. Vote on ideas you find valuable.
Share your suggestions and ideas. Vote on ideas you find valuable.
Do you want to play a crucial role in shaping Jet Global products?
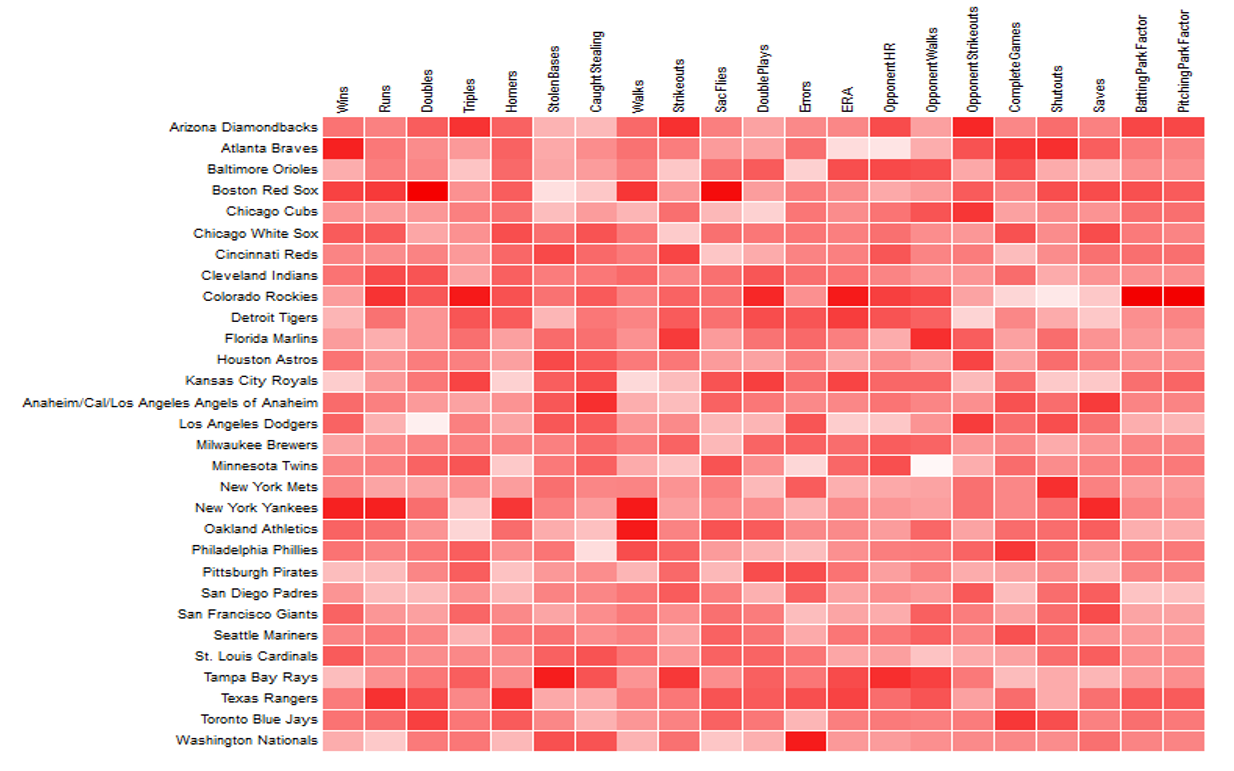
I believe we need to include a 'Heatmap' type of visualization for use within the Dashboard Builder. An example of what this would look like is included below. It would basically be treated as a matrix in which the user can define the X & Y axis', and then select a measure for the 'heat' section. It would also be nice to allow the values (or percentages) to be shown on top of the colored cells.